Monitoring Kubernetes with Prometheus and Grafana - free workshop

I've seen many changes and best practices in the past 15 years in monitoring. The shift from traditional host/service monitoring to microservices and distributed services has been the most impactful for me. It has been a wild ride to learn Kubernetes and cloud-native environments myself, with the help of the #EveryoneCanContribute cafe and 100daysofkubernetes.io from Anaïs Urlichs.
Someone from Heise.de reached out this year if I would be interested in providing a 4 hour Kubernetes Monitoring workshop. Of course. Wait. 4 hours. That's quite an intense story line, if you compare it with the recent 30min CI/CD workshops. Ok. I will never learn things if there is no challenge with talks and workshops. Accepted.
A workshop needs sustainable knowledge, and best practice from community thought leaders. From running Prometheus, digging into all exporters' source code to reading Prometheus books over to - again - the #EveryoneCanContribute cafe to actually getting trainings from PromLabs. Everything I learned thus far, with the addition of challenging myself to add exercises based on own experience (you'll know when you do the Python app deployment).
A trainer can only get better from training participants feedback - you cannot impersonate everyone when creating a training or workshop. My experience as Git and GitLab trainer, following the GitLab Developer Evangelism activities (Morehouse college course) helps here. If you have ideas around improvements for more Kubernetes Monitoring, ping me on Twitter.
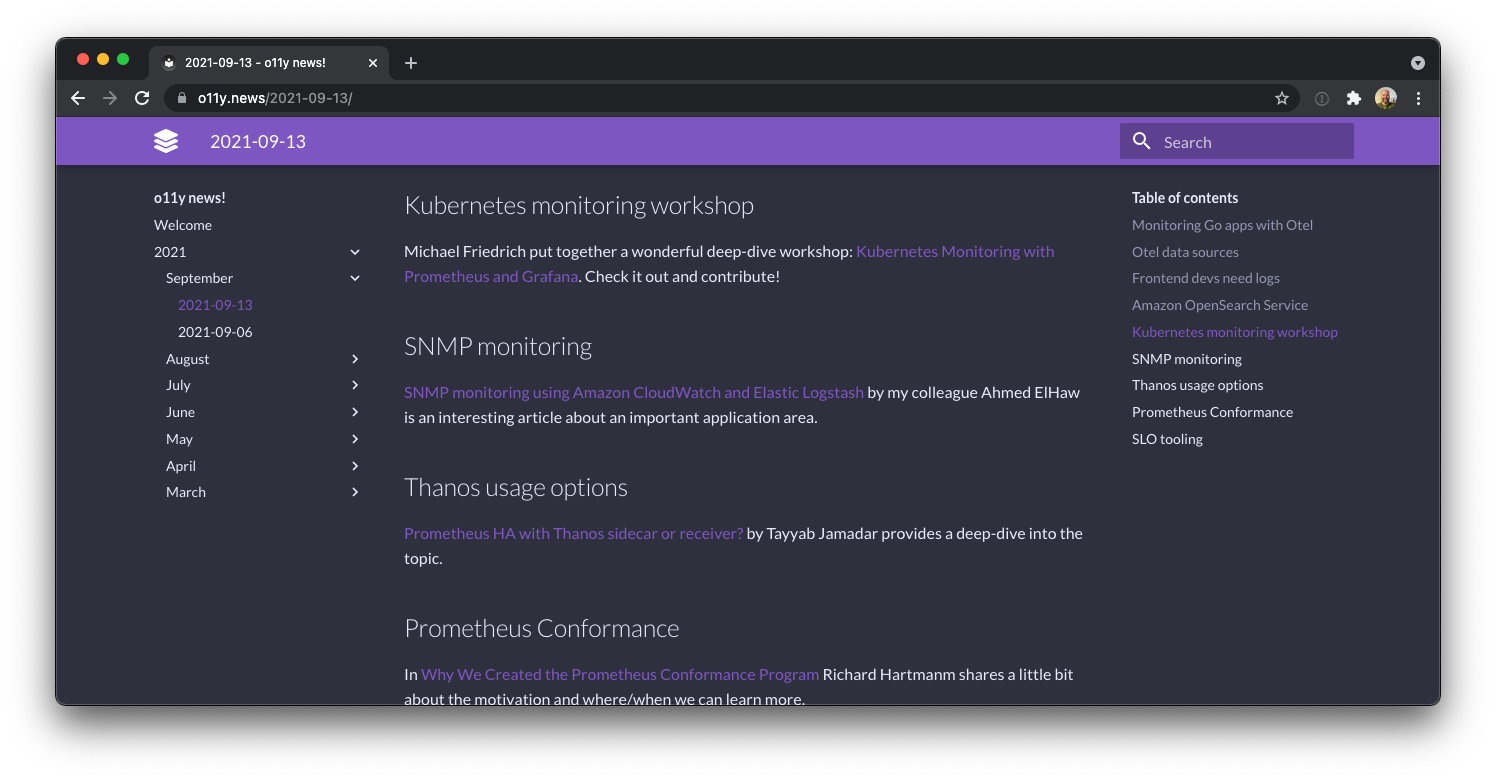
Michael Hausenblas was so kind to share the workshop in the o11y.news letter ♥️

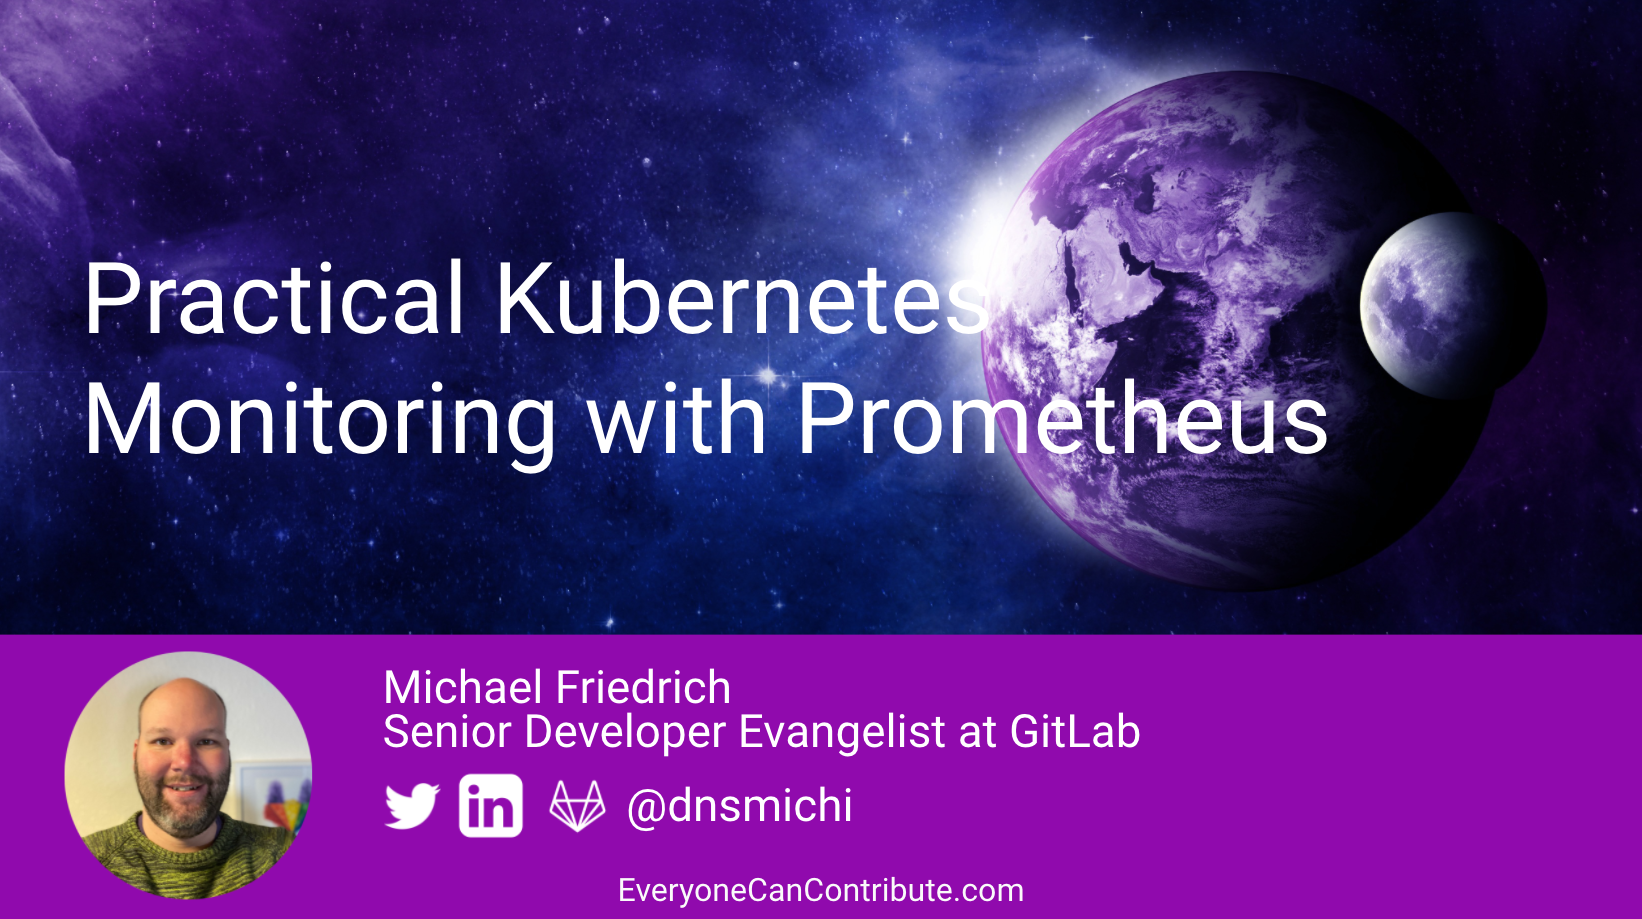
The result: A comprehensive workshop on 88 slides
You can use your local Kubernetes cluster, Amazon EKS, or anything else. For later examples, some code is located on GitLab.com - an account is recommended to fork the projects to create your own container images in the registry.
A rough outline what you can expect to learn in the following chapters:
- Monitoring, quo vadis puts the traditional monitoring in contrast to microservices.
- Prometheus and Grafana shares the basic knowledge on Prometheus, PromQL, Service Discovery and terminology required to understand.
- Kubernetes dives into understanding what to monitor, and how.
- Prometheus Operator dives into the concept of the package, and kube-prometheus installing a full stack. You'll dive into the UI of Prometheus, Grafana and the Alert Manager.
- K8s monitoring with Prometheus walks you through the - amazing - default Grafana dashboards, instructs you to deploy a Go demo app with the CRD ServiceMonitor, Container Metrics and kube-state-metrics exercises to practice PromQL queries.
- Advanced Monitoring practices with a Python app and own metrics, deployed to the GitLab container registry and to Kubernetes to query with PromQL in Grafana dashboards. Storage with Thanos/Cortex, Service Discovery is touched as well.
- Alerts and Escalations dives into the Alert Manager and rules, mapped into the PrometheusRule CRD.
- SLA, SLO, SLI keeps you busy with learning about Service Level Objectives for your production environment, providing thoughts on CI/CD quality gates with Keptn - and the OpenSLO spec, Pyrra and Sloth.
- Observability moves from Monitoring to metrics, logs, traces and beyond.
- Secure Monitoring discusses TLS, secret management, Infrastructure as code workflows, Container security and RBAC & policies.
- Ideas on more monitoring with Prometheus exporters, podtato-head, Chaos Engineering, etc.
You'll notice a few slides at the end which are marked as to-dos or ideas. I had planned very ambitiously and could not finish them yet. Stay tuned for more.
Future iterations: More talks and workshops
Learning journeys are never complete. One of my future talks is "From Monitoring to Observability: Left Shift your SLOs" touching on Prometheus, Keptn, quality gates, SLOs, Chaos Engineering and CI/CD workflows at Open Source Automation Days, All Day DevOps and Continuous Lifecycle later this year. Expect a learning journey with many URLs inside the slides to learn async.
The next iteration of the monitoring workshop is my talk on Practical Kubernetes Monitoring with Prometheus at PromCon NA at KubeCon on Oct 11. It adds more details on jsonnet to extend kube-prometheus, discusses SLO management, and best practices from the GitLab.com infrastructure. Spoiler: The recording is already uploaded, I'll wave virtually to L.A.

All for free?
In the spirit of Everyone Can Contribute, my passion is to help educate everyone with free resources. Sometimes I write code too, I prefer doing it in the open together in a live stream these days.
If you'd like to say thanks and buy me a coffee, I'd like to instead ask you for a favour:
Consider contributing to Prometheus, Kubernetes or GitLab or all of them, and cheer to the maintainers and developers.
Contributions are more than code. Create your own workshop, add a tutorial, link all resources in the documentation, spread the #monitoringlove on social media and give presentations and talks about Prometheus, Kubernetes and the cloud native ecosystem.
Share your contributions - I'd love to learn from you :-)

